
| Sacramento Forecast Project | Sacramento Metropolitan Statistical Area Economic Forecast | California State University, Sacramento |
| revised July, 2005 | ||
| Unemployment | Fountain Predictor | Earnings | Taxable Sales | Transportation | Residential Construction | Data Tables | Resources | Issues | SFP Page | ||
| Employment |
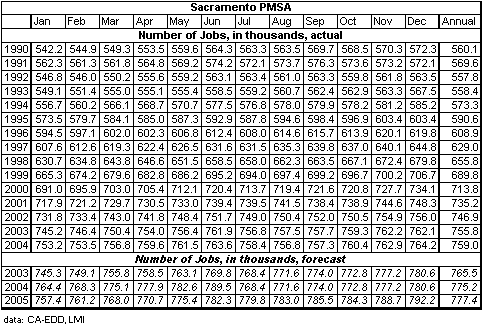
| Job Growth for the Sacramento PMSA in 2004 was very slow, with 3,200 new jobs (0.42% increase), compared to the 1.2% (8,900 job) increase in 2003. The forecast for 2005, based on actual data through December, is for a much better 2.4% (18,400 job) increase. For more details on employment in the Sacramento PMSA, see More on Employment at the bottom of this page. |
 |

| Unemployment |
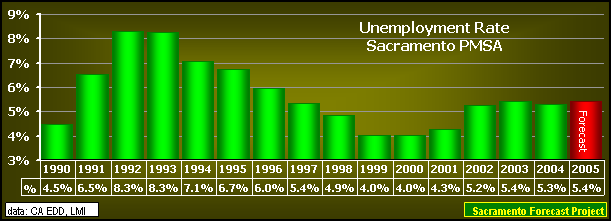
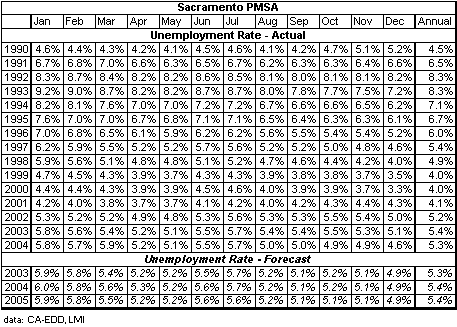
| The annual Unemployment Rate for the Sacramento PMSA rose above the 5% level in 2002, up to an annual rate of 5.2%. and stayed there through 2004, at 5.3%. This was after spending three years with an annual average of around 4.0-4.3%. The forecast for 2005, based on actual data through December, is for an annual rate of 5.4%. |
 |

| Fountain Predictor | |
| The Fountain Predictor finished 2004 with five consecutive positve values beginning in August with 0.393% and ending in December with 0.53%. Before the posivitve trend began the revised July value was a negative 0.004% and the June positive (0.029%) came after the negative results for February through May of 2004, and the flipflopping between a positive November, 2003 (0.052%), a negative December, 2003 (-0.111%), and a positive January, 2004 (0.019%). The Predictor turned negative in August of 2001, stayed negative throughout the entire year of 2002 and through September of 2003, marking 26 straight months of being negative. |
|
 |
|
| The Fountain Predictor was named for Robert J. Fountain (Professor Emeritus, California State University, Sacramento) who suggested graphically comparing the twelve month percentage change in the Number of Persons Employed with the twelve month percentage change in the Civilian Labor Force as a measure of the economic health of an area. | The theory suggests that as long as the percentage change in the Number of Persons Employed is larger than (above) the percentage change in the Civilian Labor Force, for that area, that area is in good economic health. |

| Average Weekly Earnings, Manufacturing |
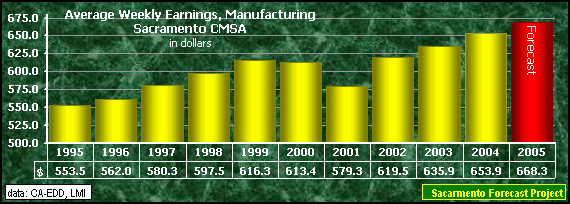
| The Average Weekly Earnings for Manufacturing workers in the Sacramento PMSA reached a new high of $653.90 in 2004, an increase of $18.00 (2.8%), up from the 2003 high of $635.90. The forecast for 2005, for average weekly earnings, Manufacturing workers is for a smaller 2.2% ($14.40) increase to $668.30. The advantage of Manufacturing workers in the Sacramento PMSA over California's Manufacturing workers in terms of average weekly income continues - see the comparison.--> |
 |

| Taxable Sales |
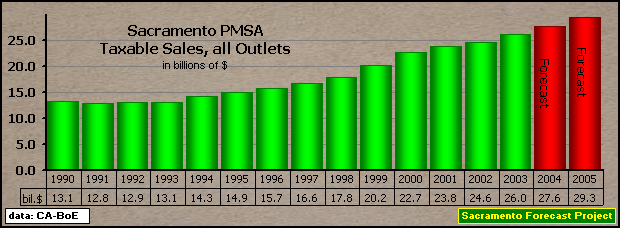
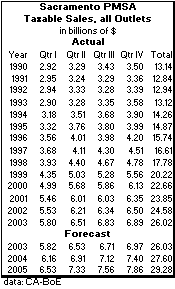
| Taxable sales, all Outlets in the 3 county PMSA grew at a 5.9% ($1.4 billion) rate in 2003, up from slower 3.1% increase in 2002. The forecast for 2004 and 2005 (based on actual data through the 4th quarter, 2003) is a stronger 6.1% each year. One of the main components in taxable sales is the market for automobiles. --The Sacramento MSA out-paced California in most categories during the 1990's, see Taxable Sales Changes. |
 |

| Sacramento International Airport |
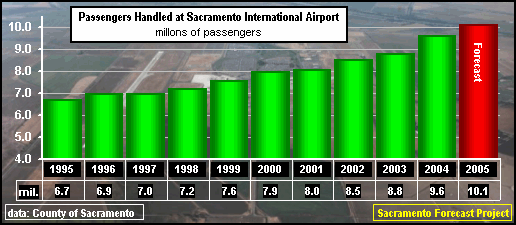
| The Sacramento International Airport continued to record new highs in passenger handling in 2004, up an additional 800,000 to 9.6 million persons. The forecast for 2005 is for an additional 500,000 passengers to 10.1 million persons. |
 |
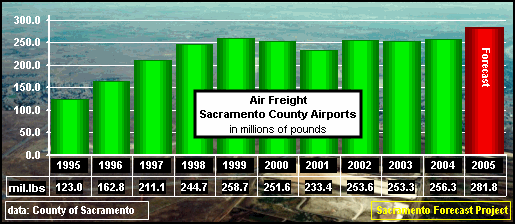
| The growth in freight handled at the county's airports, which increased in 2002 to 253.6 million pounds, stalled in 2003, at 253.3 million pounds, rebound in 2004 to 256.3 million pounds. The forecast for 2005 is a strong increase to 281.8 million pounds handled. |
 |

| Subdivision Traffic |
| Interest in new home construction, as measured by the traffic touring new developments in the four county (Sacramento, Placer, El Dorado and Yolo) area, advanced each year from 1995 through 2002. The traffic declined 4.2% in 2003, but rebounded to a new high of 537,673 visits in 2004. The forecast for Traffic in 2005, based on actual data through December, is for a slower 5.8% increase to 569,020 visits. |
 |
| Net New Home Sales |
| Net New Home Sales in Sacramento, Placer, El Dorado and Yolo Counties, as measured by the BIA surged in 2002, increasing 59.6% to 9,617 home sales, declined 7.0% in 2003 to 8,942 home sales, and rebounded in 2004 by increasing 6.6% to 9,530 home sales. The forecast for 2005, based on actual data through December, is for an increase of 5.9%. |
 |
| Residential Building Permits |
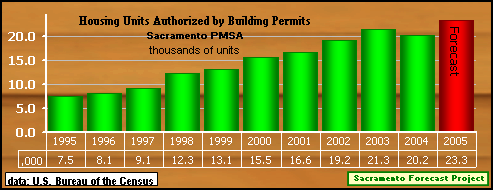
| Housing Units Authorized by Building Permits in the Sacramento (three county) PMSA had increased each year from 1995 to 2003. The largest percentage increase was the 19% increase in 2000 and the largest number increase was 2,586 permits in 2002. That all changed in 2004, when the number of unit permits declined from 21,300 in 2003 to 20,200 unit permits. The forecast for 2005 is for an increase to an annual total of 23,300 permits. I thinking that I may be revising this down some in July. |
 |
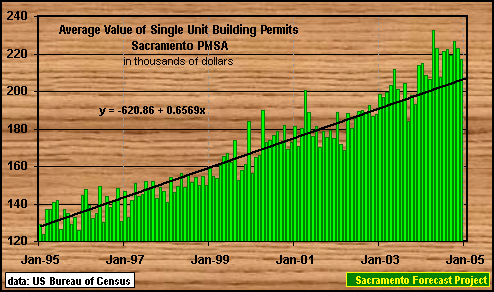
| The average value of single unit building permits in the Sacramento PMSA has been increasing at an monthly average rate of $657.00 since January of 1995. Although the actual value, based on data from the U. S. Census Bureau's survey, varies from month to month, the underlying trend has stayed consistent. |
 |

| Data Tables |
| The Sacramento Forecast Project maintains several files of Sacramento MSA data, in Excel format, that can be made available on request. |
Employment |
 |
 |
Taxable Sales |
|
Transportation |

|

|
Residential Construction |

|

|

|

| Resources |
For information about the Metropolitan Statistical Area and its business environment, try
Data Providers: |

| Issues |
To Downtown Arena or Not To Downtown Arena - An active question in the Sacramento MSA.
|

Additional information on Employment in the Sacramento MSA
|

| Back to Sacramento Forecast Project Update: July, 2005 Next Revision: January, 2006 URL: http://www.csus.edu/indiv/j/jensena/sfp/sa11/sac5/sac3/sac-msa.htm Arthur N. Jensen, Emeritus Professor of Marketing e-mail to: jensena@csus.edu College of Business Administration California State University, Sacramento Disclaimer: Professor Arthur N. Jensen takes full responsibility for the information posted. The information on this page represents that of Professor Arthur N. Jensen and not that of California State University, Sacramento. [as required in PM BA 96-13 Policy on CSUSInfo World Wide Web] |