| Sacramento Region Economic Forecast | ||
| revised January, 2013 | ||
| Unemployment Rate | Taxable Sales | Building Permits | Data Tables | Resources | SFP Page | ||
| The Sacramento Region is the combination of six counties (El Dorado, Placer, Sacramento, Sutter, Yolo and Yuba) or 2 MSA's (Sacramento and Yuba City). It is also the geographic area covered by the Sacramento Area Council of Governments (SACOG). |
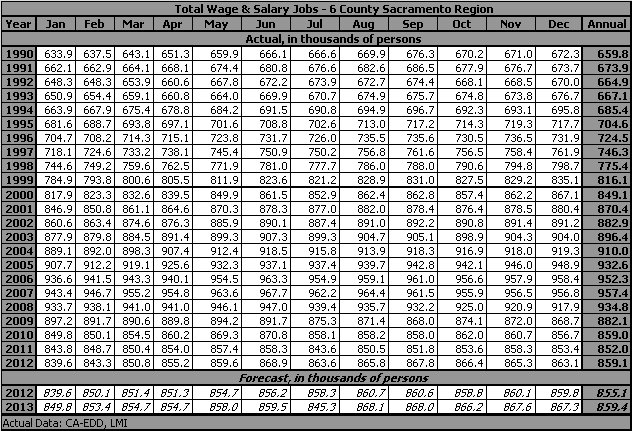
| Wage and Salary Jobs |
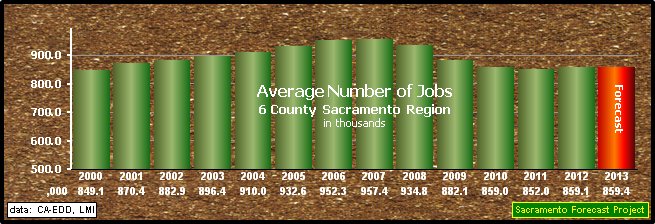
| 31Jan13: The number of new jobs in the Sacramento Region declined from 2007 through 2011, ending with a total of 852,000 jobs in the region. The region experienced its first increase in the number of jobs in 2012 with a 0.8% (7,100 job) increase. The forecast for 2013, based on actual data through December, 2012, is for a very small increase of 0.03% (300 jobs) to a total of 859,400 jobs in the region. |
 |

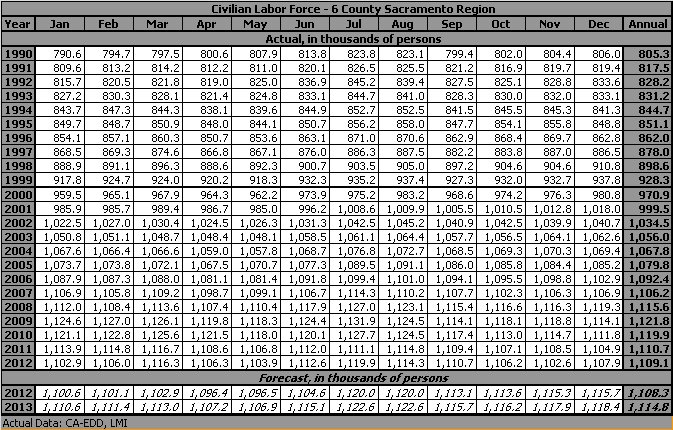
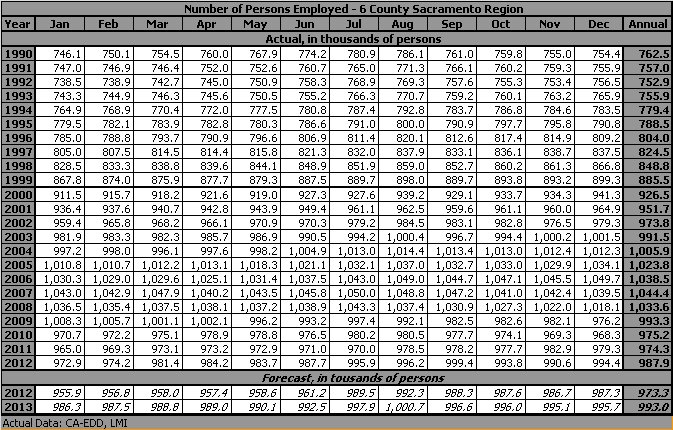
| Unemployment Rate |
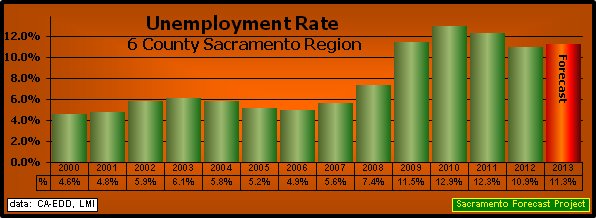
| 31Jan13: The annual average Unemployment Rate for the Sacramento (6 County) Region in 2012 was 10.9%, down from the 12.3% in 2011. The Sacramento Region's annual Unemployment Rate, based on actual data through December, 2012, is expected to increase to 11.3% in 2013. |
 |
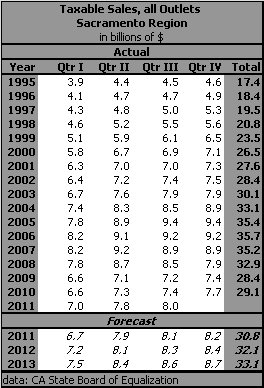
| Taxable Sales |
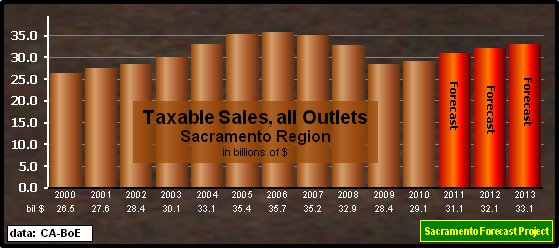
| 31Jan13: Taxable Sales for all outlets in the Sacramento Region increased 2.5% ($700. million) in 2010, the first increase in the last 4 years. The forecast for 2011, based on reported results through the 3rd quarter of 2011, is for an increase of 6.9% ($2.0 billion). The forecast for 2012 is for a 3.3% increase, followed by a similar 3.3% increase in 2013. |
 |
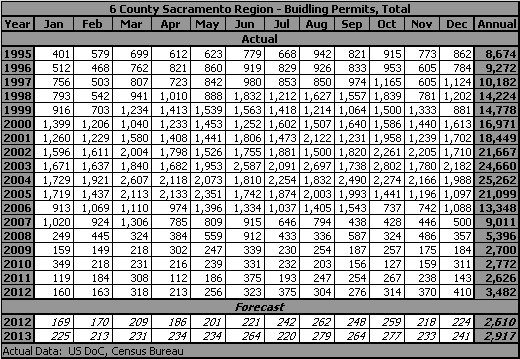
| Building Permits |
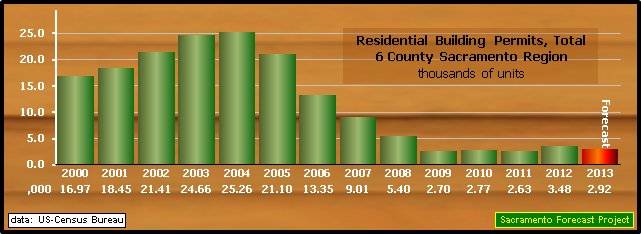
| 31Jan13: Residential construction, as measured by building permits, in the six county Sacramento Region has dropped from the 2004 top of more than 25,000 new units. The decline ended in 2009 when there were only 2,700 permits issued, followed in 2010 when there was an increase of 70 permits issued (2.65%) but was then followed in 2011 with a 5.3% (150 permit) decline. The number of residential permits increased in 2012 by 32.6% (860 permits) to a total of 3,482 in the six County Region. The forecast for 2013, based on actual data through December, 2012, is for an 16.2% decrease to 2,920 permits. |
 |
| Data Tables | ||
| The Sacramento Forecast Project maintains files for these variables and the supporting variables for the Sacramento Region, in Excel format, that can be made available on request. | ||
 |
||
 |
||
 |
||
 |
||
 |
||
| Resources | ||
For information on the Sacramento Region.
Data Providers: |
||
|
Back to Sacramento Forecast Project Update: January, 2013 Next Revision: July, 2013 URL: http://sacramentoforecastproject.org/sa11/sac-reg.htm Arthur N. Jensen, Emeritus Professor of Marketing e-mail to: a.jensen@comcast.net |