| Variable Comparison: United States vs California vs Sacramento MSA | ||
| revised January, 2012 | ||
| Establishment Survey | Taxable Sales | Transportation | Residential Construction | SFP Page | ||
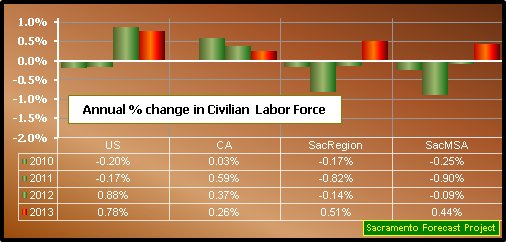
| What follows is a graphical comparison of the economic activity of a number of variables across several geographic divisions; usually the US compared to California and one or more of the Sacramento geographic areas. In most instances, the comparison is in the form of annual percentage changes to allow direct comparison among the areas. |
| Household Survey |
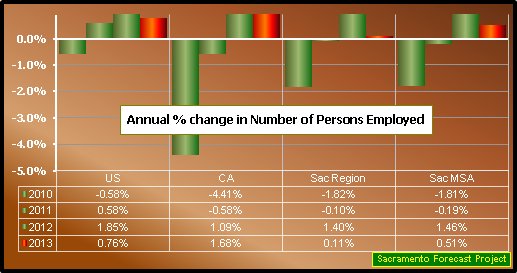
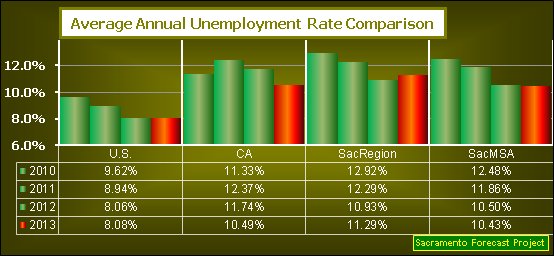
| I'm using the title "Household Survey" to identify the "Current Population Survey", a monthly household survey conducted by the Bureau of the Census for the Bureau of Labor Statistics, which provides a comprehensive body of information on the employment and unemployment experience of the Nation's population, classified by age, sex, race, and a variety of other characteristics. The specifics of the survey are explained in a document entitled How the Government Measures Unemployment. |
 |
 |
 |

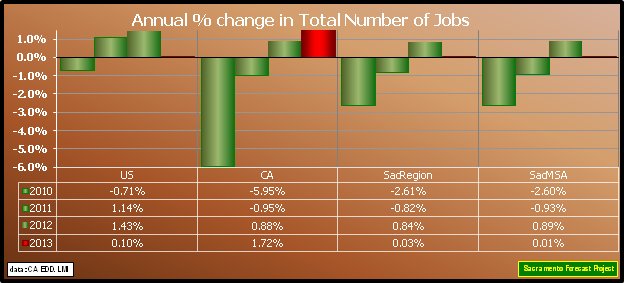
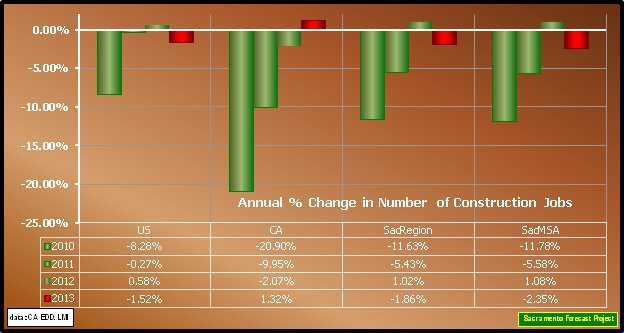
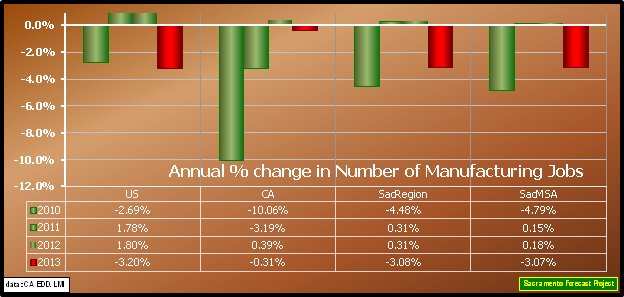
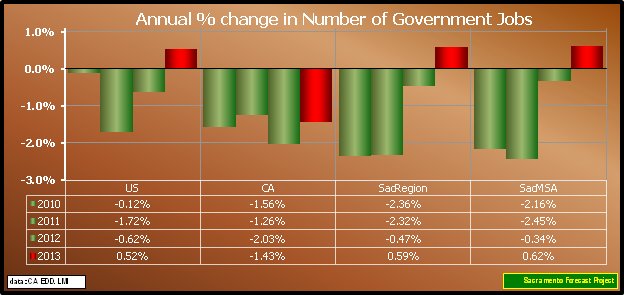
| Establishment Survey |
| I'm using the title "Establishment Survey" to identify the "Current Employment Statistics" (CES) program conducted by the Bureau of Labor Statistics of the Department of Labor and which surveys about 160,000 businesses and government agencies, representing approximately 400,000 individual worksites, in order to provide detailed industry data on employment, hours, and earnings of workers on nonfarm payrolls. |
 |
 |
 |
 |
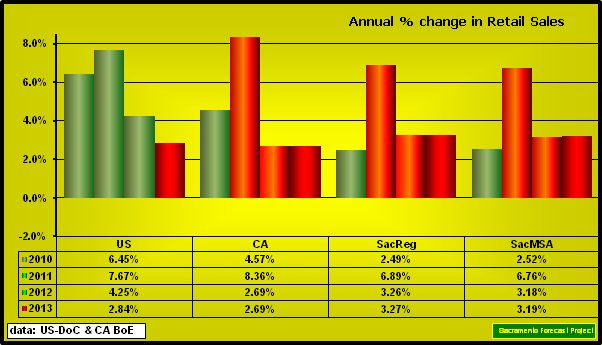
| Retail/Taxable Sales |
 |
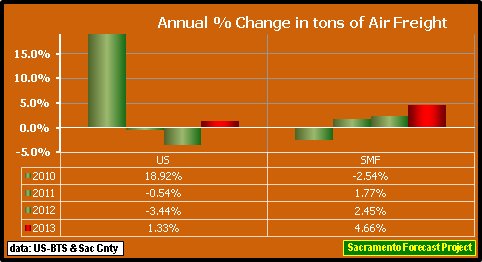
| Transportation |
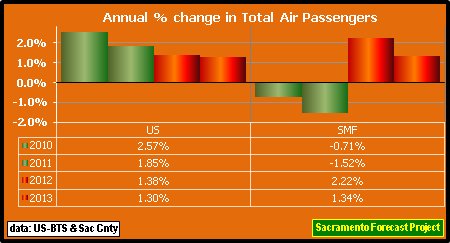 |
 |
| Residential Construction |
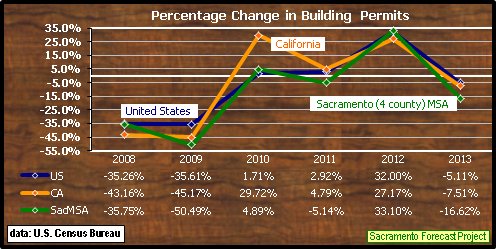 |
| Back to Sacramento Forecast Project Update: January, 2013 Next Revision: July, 2013 URL: http://sacramentoforecastproject.org/variable/variable.htm Arthur N. Jensen, Emeritus Professor of Marketing e-mail to: a.jensen@comcast.net |