| Fountain Predictor for U.S. Employment | ||
| revised January, 2011 |
 | |
|
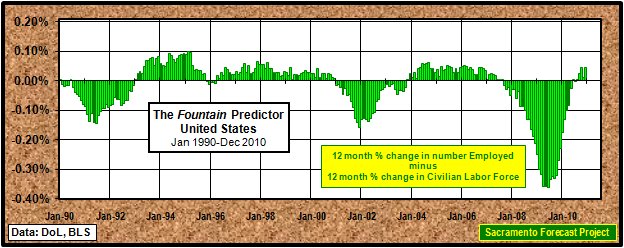
8Jan11: The predictor turned positive in June (0.005%), reversed to (-0.003%) in July before turning positive in August (0.005%) and generally increasing through the preliminary December numbers which put the Predictor at(0.047%). On the surface, this looks like confirmation of the recovery that hit bottom in June, 2009 (-0.36%), but as I mentioned back in September (see below) the positive predictor is not the result of a growing number of persons employed - that value has been Very slowly increasing since September - rather it is coming from a declining Civilian Labor Force; e.g., people are stopping the job search and dropping out of the labor force. So, again, this may well be a false positive. 3Sep10: The preliminary August numbers put the Predictor above the Zero line (0.006%). While the number is preliminary and subject to change, it is a continuation of the rather mixed message the Predictor has been showing the last couple of months. The positive value resulted from the 12 month change in the Number of Persons Employed falling only 0.011% in August while the Civilian Labor Force fell even more (0.017%). So both variables are less than their 12 month previous values, but for the first time in this cycle, the Civiliam Labor Force decline is greater than the decline in the Number of Persons Employed - and the positive Fountain Predictor value is not the result of job growth which has been relatively flat; i.e., possibly a false positive. 27Aug10: Put off the celebration a little longer. The July release didn't change June's zero value but July's Predictor value came in at -0.009%, backing away from the Zero Line. The releae of the August numbers next week should clarify the trend. 4Jul10: Right on schedule (!) the predictor is at ZERO after 33 months of negative values, one month short of the previous negative 34 month span that ended in October, 2003. The June values for the Civilian Labor Force and the Number of Persons Employed both declined by 0.055% from their respective values a year ago - Good News? Well remember that the June values reported by the Bureau of Labor Statistics are Preliminary and subject of change/revision over at least the next two months...so keep the celebrations muted for a month or so. |
|
 |
|
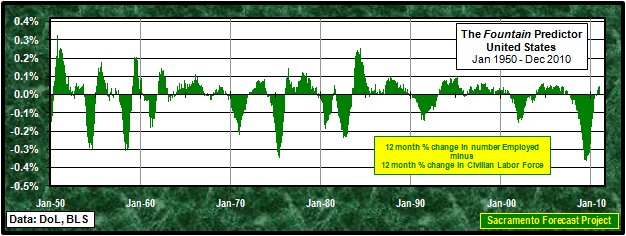
| The Fountain Predictor was named for Robert J. Fountain (Professor Emeritus, California State University, Sacramento) who suggested graphically comparing the twelve month percentage change in the Number of Persons Employed with the twelve month percentage change in the Civilian Labor Force as a measure the economic health of an area. | The theory suggests that as long as the percentage change in the Number of Persons Employed is larger than (above) the percentage change in the Civilian Labor Force, for that area, that area is in good economic health. |
|
Back to United States Forecast Page Update: January, 2011 Next Revision: July, 2011 or sooner Arthur N. Jensen, Professor Emeritus of Marketing e-mail to: a.jensen@comcast.net |