| Economic Forecast for the United States | ||
| revised January, 2013 | ||
| Real Growth | Unemployment | Inflation | Resources | SFP Page | ||
Real Growth | |
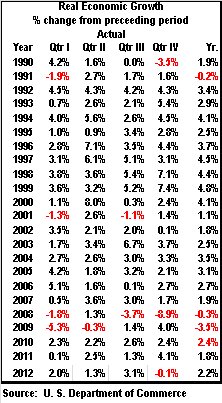
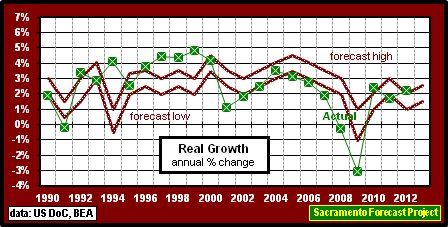
31Jan13: The advance results for the 4th quarter of 2012 are in. In January, I said that I was expecting an annual real growth in the range between 1.5% and 2.5%, higher than some forecasts but lower than others. Then, in July I said, "I'm now lowering the range for the annual real growth to between 1% and 2%." I should have left well enough alone, because the 4th quarter "advance" come in at -0.1 percent, the full year change of 2.2% was just above the new high I set in July. I also said that the percentage change would go lower but I believed that the current administration will keep the reported numbers for real growth out of the negative range as long as possible - well after October, it did not matter any longer. Given B.Obama's & B.Bernanke's willingness to indenture our future generations and given the opportunities in Congress's view of healthcare, I'm expecting there to be little change in the economy during 2013, so I'm leaving the forecast range at the 1.5% to 2.5% level. | |
 |
 |

Unemployment Rate | |
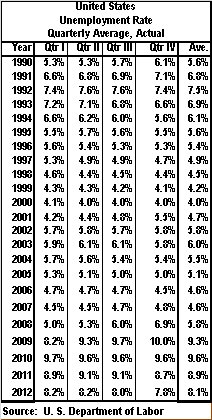
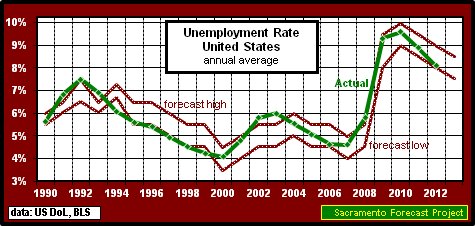
| 31Jan13:: The Annual Average Unemployment Rate for the U.S. declined to 8.1% in 2012, down 0.8% from the 2011 rate and close to the low of the 8.0% to 9.0% range that I predicted last January. I expect the ANNUAL Average Unemployment Rate to decline again to between 7.5% and 8.5% in 2013. For a historical perspective of the Unemployment Rate, here's a graph of the last one hundred and two years. |
|
 |
 |
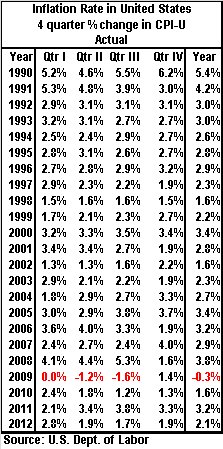
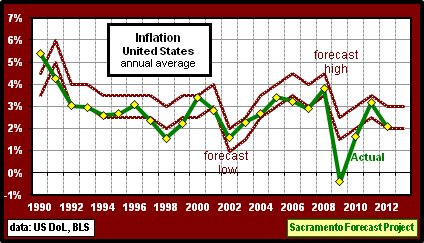
Inflation | |
| 31Jan13: At the risk of sounding like a broken record - my expectations have not changed - Inflation is coming back. The preasure is still building as the deficit and money supply grow. These are the inflationary forces present that support the federal government policies and I still don't expect the economy to continue to accommodate these actions over the long term. The longer it takes, the stronger the response - review the economic history of the late 1970's and the Fed's policy switch on October 6, 1979.
I started the 2012 inflation forecast with a range of between 3.0% and 4.0% last January, then lowered the range to 2.0% to 3.0% in July - good move because the annual rate for 2012 was 2.1%, just above the range low. Regardless of my long range expectations, I'm keeping the range for the inflation rate as measured by the Consumer Price Index at between 2.0% and 3.0% for 2013.
Check out Inflation: 1915 to Present for a historical perspective of the Consumer Price Index, CPI-U. |
|
 |
 |
Resources | ||
|
Want another forecast... Checkout the UCLA - Anderson Business Forecast or the Sac State's Business College Forecast Check the past forecasts for this project: The complete record is in Table form, or view the graphs of Real Growth, Unemployment, and Inflation. The Sacramento Forecast Project maintains several databases, in Excel format, that can be made available on request. |
||
|
Back to Sacramento Forecast Project Revised: January, 2013 Next Revision: July, 2013 Arthur N. Jensen, Emeritus Professor of Marketing e-mail to: a.jensen@comcast.net |