| Sacramento Combined Statistical Area Economic Forecast | ||
| revised January, 2013 | ||
| Unemployment | Taxable Sales | Data Tables | Resources | back to SFP Page | ||
| The Sacramento--Arden-Arcade--Truckee,CA-NV Combined Statistical Area, or what I call the Sacramento CSA, is one of the 116 CSA's created in the latest designations by the Office of Management and Budget for the Federal Government. It is made up of one Metropolitan Statistical Area Sacramento--Arden-Arcade--Roseville--Woodland,CA Metropolitan Statistical Area) and two Micropolitan Statistical Areas (Gardnerville Ranchos, NV Micropolitan Statistical Area and Truckee-Grass Valley, CA Micropolitan Statistical Area). This "inter-state" CSA is the result of sharing the coast-line of Lake Tahoe and the employment/resident relationship that has occurred in that region, particularly between Douglas County, Nevada and eastern El Dorado County, California. |
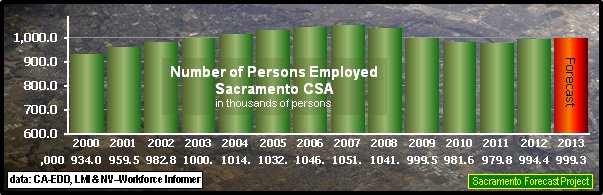
| Number of Persons Employed |
| The Sacramento Combined Statistical Area ended 2012 with an annual average of 994.400 employed persons. This was a 1.49% (14,600 peerson) increase> over the level in 2011 which was a 0.84% (8.2 thousand persons) decrease over the 973.4million employed persons in 2010. The annual average number of persons employed in the Sacramento CSA is forecasted to increase, based on actual data through December,2012, by 0.5% (4,800 persons) in 2013. |
 |

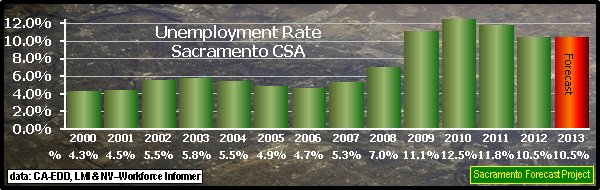
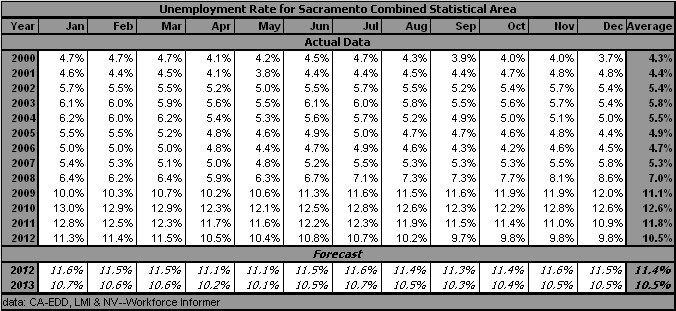
| Unemployment |
| The annual Unemployment Rate for the Sacramento CSA was 10.5% in 2012, down from the 11.8% rate in 2011. The average annual rate for 2013, based on actual data through June,2012, is expected remain at the 10.5% level - no change. |
 |
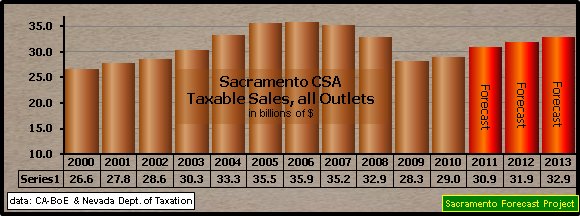
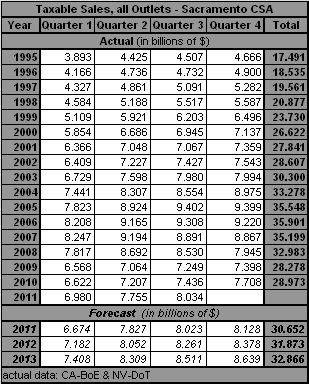
| Taxable Sales |
| Taxable Sales at all Outlets in the six county Combined Statistical Area posted a 2.5% ($700. million) increase in 2010, after a large $4.7 billion decrease in 2009 (an decrease of 14.1%) to a total of $28.3 billion, compared to a smaller 6.4% decrease in 2008. The forecast for 2011, based on actual data through the 3rd quarter, 2011, is for a 6.6% increase, followed by a 3.2% increase in 2012 and a similar 3.1% increase in 2013. |
 |
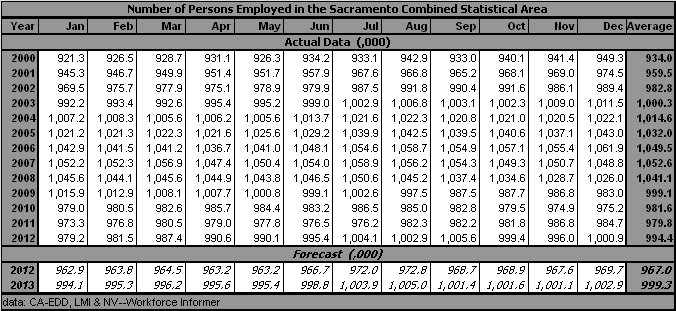
| Data Tables |
| The Sacramento Forecast Project maintains files for these variables and some of the supporting variables for the Sacramento CSA data, in Excel format, that can be made available on request. |
|
 |
 |
|
Back to Sacramento Forecast Project Update: January, 2013 Next Revision: July, 2013 URL: http://sacramentoforecastproject.org/sa11/sac6/sac6_csa.htm Arthur N. Jensen, Emeritus Professor of Marketing e-mail to: a.jensen@comcast.net |