| Sacramento Forecast Project | State of California Economic Forecast | Sacramento Forecast Project |
| Revised: January, 2013 | ||
| Unemployment || Taxable Sales | Inflation | Residential Building Permits | Data Tables | Resources | SFP Page | ||
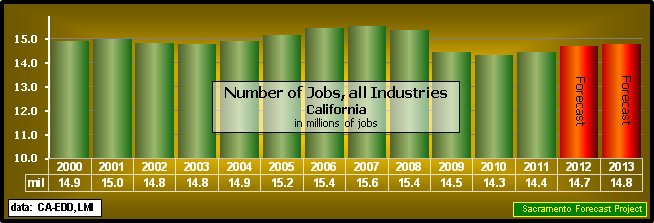
| Employment |
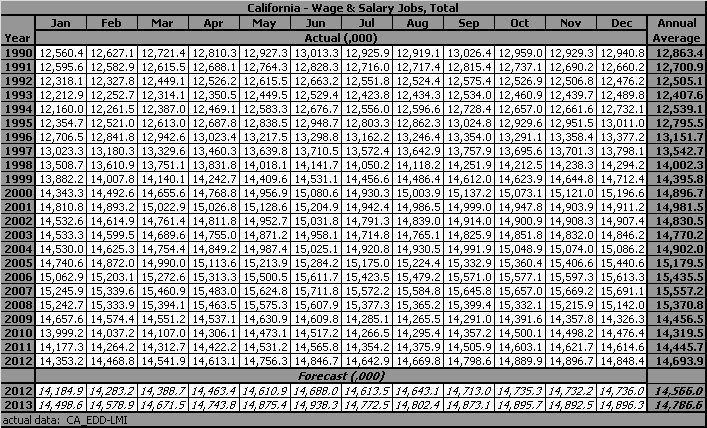
| 21Jan13: The average number of jobs, based on the "Establishment Survey", in California increased in 2012 by 1.72%, bringing the total number of jobs back to above the 2009 level of 14,500 jobs. The increase also extended to two the number of years of increased jobs from the "Establishment Survey". The forecast for 2013, based on actual data through December, 2012, is for a smaller 0.6% increase. |
|

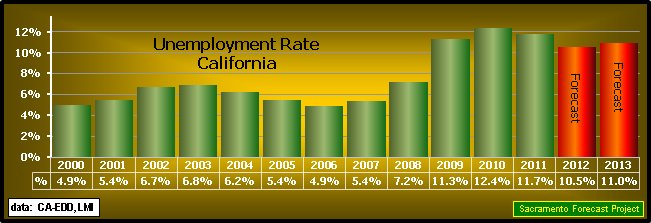
| Unemployment |
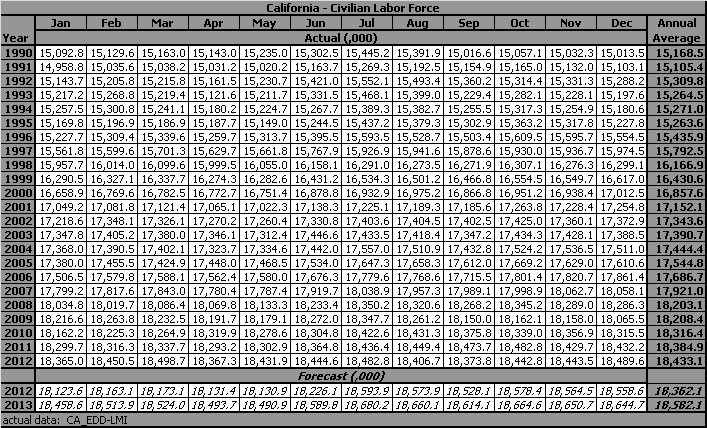
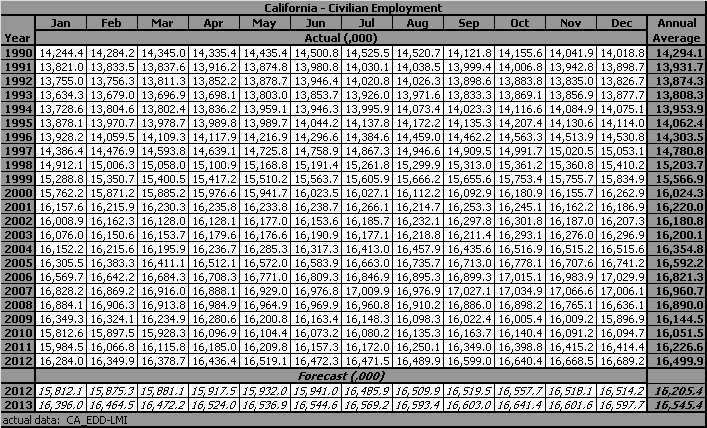
| 21Jan13: The average annual Unemployment Rate for 2012 was 10.5%, down from the 11.7% rate in 2011. The annual rate forecast for 2013, based on actual data through December, 2012, is a higher 11.0%. |
|
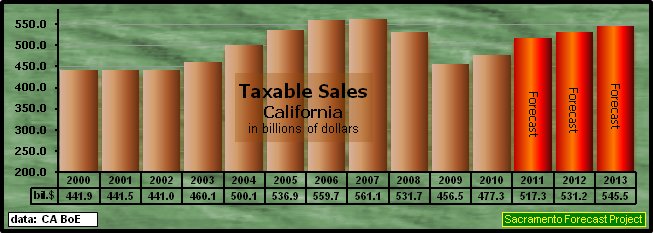
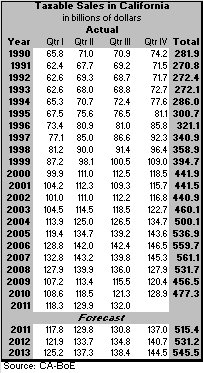
| Taxable Sales |
| 21Jan13: California's Taxable Sales increased 4.57% in 2010, after a serious 14.14% ($75.2 billion) drop in 2009. Based on actual data through the 3rd quarter of 2011, the 2011 Taxable Sales forecast is for an increase of 8.4% ($39.9 billion), followed by a 2.7% increase in 2012 and a 2.7% increase in 2013. A word of caution about these forecasts. Actual data for Taxable Sales are currently 5 quarters (close to 6 quarters) behind, so the "current" data does not reflect any of the actions and events of the past year. The historical fifty-three year record of Taxable Sales in California and forecasts through 2013. |
 |
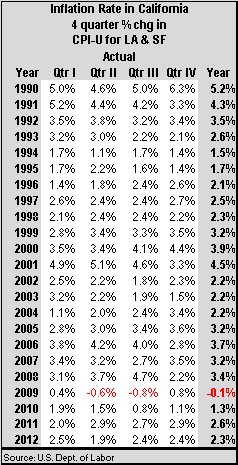
| Consumer Price Index |
| 21Jan13: The average Inflation (percentage change in the CPI) rate for California in 2012 was 2.3% for the year, compared with the national rate of 2.1%. The "rubber-band" keeps stretching and it is about as far as it take and all of the best efforts of the Fed and the Federal Administration will not be able to do much to contain the snap when the band breaks - go back and review the late 1970's. I have, however, kept the forecast range for 2013 to between 2.0% and 3.0% for both the nation and the state. |
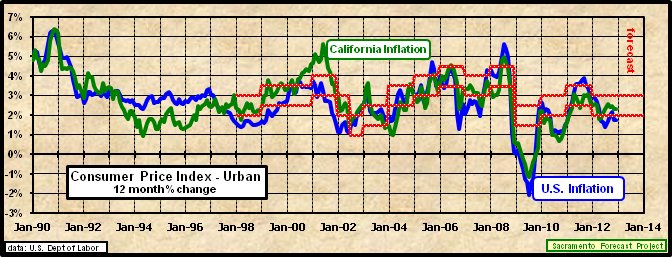 |
| The two metropolitan areas used for calculation of the CPI in California are the San Francisco MSA and the Los Angeles MSA. The two areas have exchanged inflationary leadership a number of times over the years. The Los Angeles MSA had leaped ahead during the early part if 2008 - bigger commute costs, but as the price of oil dropped, the Los Angeles CPI fell faster than the San Francisco CPI and now the two areas continue to move together. |
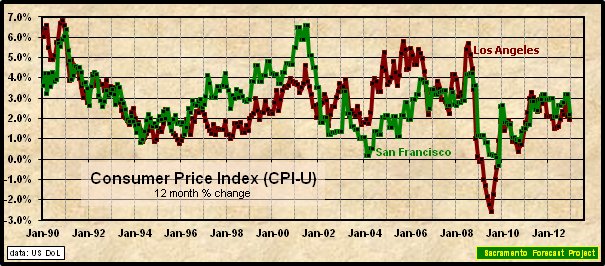 |
| NOTE: California's inflation rate, as calculated by the Sacramento Forecast Project, is the average of the San Francisco MSA CPI and the Los Angeles MSA CPI. The US Department of Labor has changed the reporting of the San Francisco MSA to semi-monthly (the Los Angeles CPI is still reported monthly) and calculation of the average reflects that adjustment. For those months that no CPI is reported, the average is calculated using the previous month's CPI. |
| Data Tables | |||
| The Sacramento Forecast Project maintains files for these variables and the supporting variables for California, in Excel format, that can be made available on request. | |||
 |
|||
 |
|||
 |
|||
 |
 |
||
| Resources |
|
Want another forecast... Checkout the UCLA - Anderson Business Forecast. Data Providers: |
|
Back to Sacramento Forecast Project Update: January, 2013 Next Revision: July, 2013 Arthur N. Jensen, Emeritus Professor of Marketing e-mail to: a.jensen@comcast.net |